Chris Gaffney

By Chris Gaffney, Managing Director, Georgia Tech Supply Chain and Logistics Institute
I was on a run on a cool Saturday morning in February when military activity began in Iran. I, like many others, listened and wondered about the impact and duration of this on regional and global supply chains. Over the next few weeks, I talked to many in my network and heard their concerns. They wanted to know how long we thought this would last and what the cascading impacts would be. The Strait of Hormuz had closed on February 28, and even for those with robust contingency plans, this was not on their bingo card.
I happened to be traveling to Washington D.C. the following weekend and had a fair amount of downtime in airports. I had just started my Claude subscription and I wondered if it could help me build a model to project the impact of the closure on the petrochemical supply chain and its products if the closure went longer than expected. I did the research, and it helped me build, test, and validate a Monte Carlo simulation. We discussed what we learned from the model in our article "What the Public Discussion on Hormuz Is Still Getting Wrong."
We are now eight months into this and the Strait is still not free for passage. I have listened to many podcasts, watched many YouTube videos, and read many articles. I was surprised by several developments as the crisis played out. So I thought it was a good time to see what we got right and what we can learn for the future.
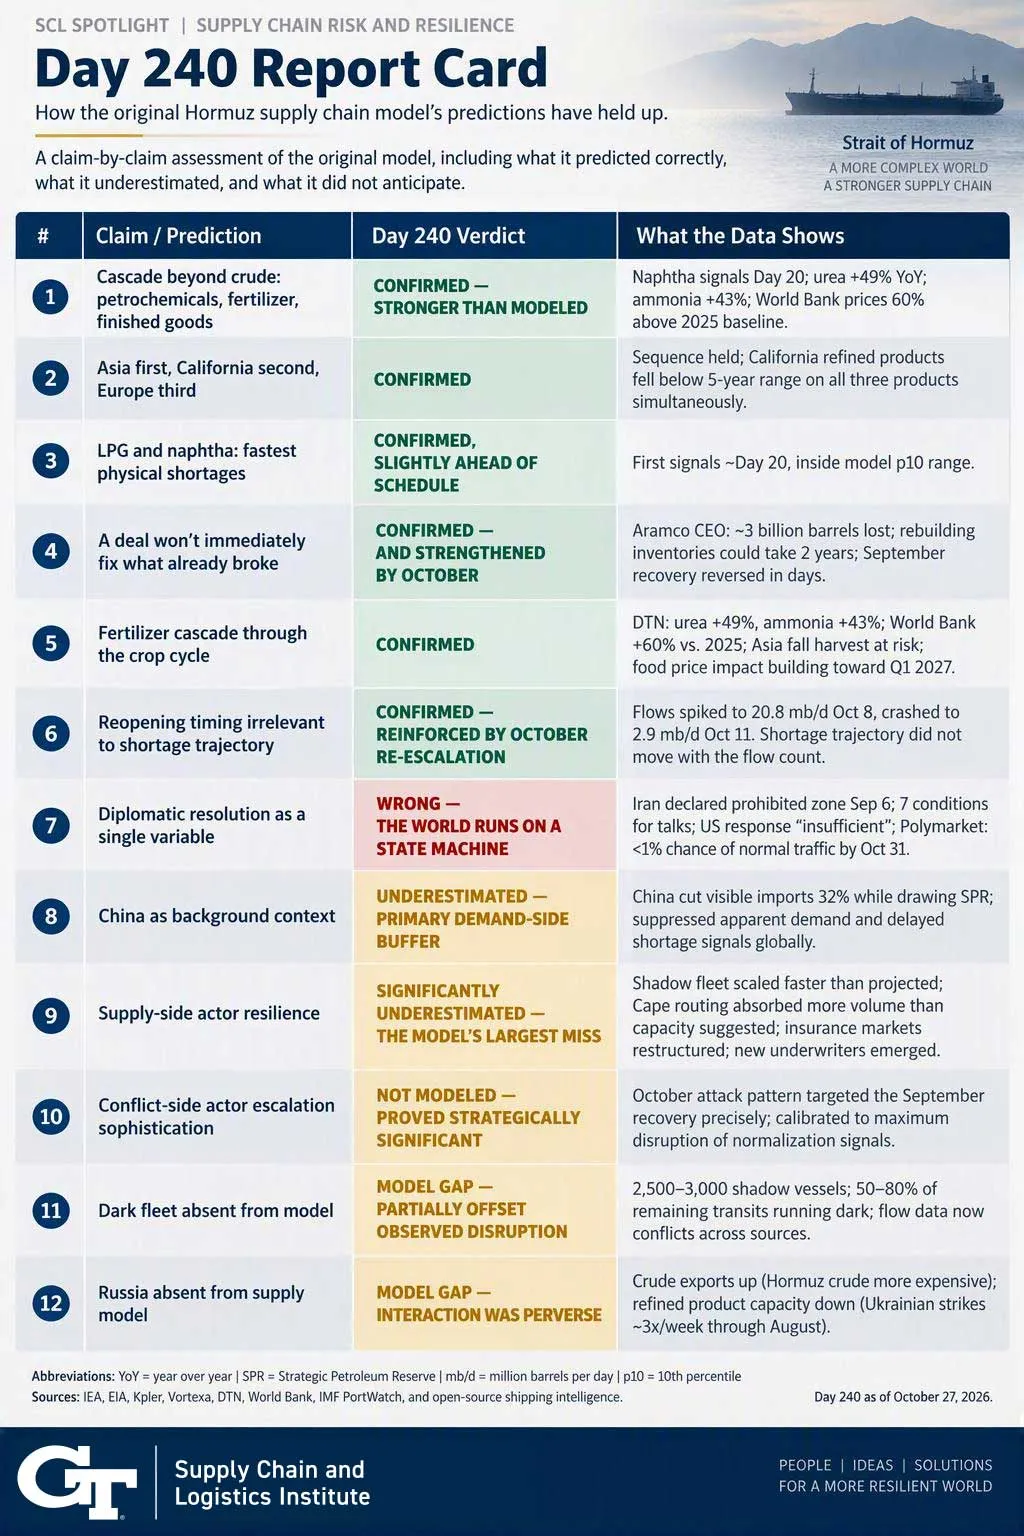
The model got a lot right. The physical cascade sequence was pretty accurate: naphtha and LPG first, petrochemicals next, fertilizers following, and finished goods last. The geographic impact assumptions were also on target: Asia felt the effects early, followed by Europe, with the U.S. experiencing a later impact on diesel. The argument that a diplomatic deal wouldn't immediately fix the shortage has also played out, and unfortunately continues to be accurate. If you want the full report card, it's at the end of this piece.
But the two biggest misses in the model were not data problems. They were structural blind spots. And they point to the same root cause.
“We modeled how the system would respond to the shock. We didn't model how every actor in the system would refuse to accept the outcome the model predicted.”
On the supply side, the adaptation was more creative and more persistent than any reasonable pre-crisis forecast would have assumed. On the conflict side, the escalation was more strategically sophisticated than a standard military disruption model would have captured. Both failures came from the same assumption: that actors in the system would respond to the disruption rather than actively reshape it.
That assumption was wrong. And understanding why it was wrong is more valuable than any individual forecast the model produced.
The model got the physical story right.
The supply chain cascade the model predicted has unfolded largely as projected. Naphtha shortage signals appeared around Day 20. Urea prices are up 49% year-over-year. Anhydrous ammonia is up 43% (DTN). The World Bank has fertilizer prices 60% above the 2025 baseline. The crop cycle lag means the food price impact is still building toward a Q1 2027 peak.
The geographic sequence held: Asia crude imports fell first and most sharply, California refined products dropped below the five-year range on gasoline, diesel, and jet fuel simultaneously, and Europe felt the jet fuel impact third. Aramco's CEO has put the cumulative supply loss at nearly three billion barrels, with inventory rebuilding likely taking up to two years.
The model also called the most counterintuitive point correctly: the reopening date, whenever it comes, will be largely irrelevant to shortage timing. Supply chains don't recover on the day a diplomatic deal is signed. That argument has been validated repeatedly, most recently by September's partial recovery, which reversed completely within days once October's attack surge resumed.
Getting the physical story right matters. It gave organizations a framework for prioritization and response. The more important lesson is what the model didn't see.
The supply chain was more resilient than we modeled. The actors kept finding new levers.
The model assumed that supply chain participants would respond to the disruption within the bounds of existing infrastructure, capacity, and risk tolerance. That assumption underestimated human ingenuity at scale under pressure.
The shadow fleet scaled faster than anyone projected. Between 2,500 and 3,000 vessels now operate without standard tracking, insurance, or port-state oversight. These vessels account for an estimated 50-80% of remaining Hormuz transits. This fleet didn't exist at that scale before the crisis. It was assembled, financed, and operationalized in real time as an adaptive response to the closure, and it materially offset the disruption the model predicted.
Alternative routing absorbed more volume than design capacity suggested was possible. The Cape of Good Hope route adds 10-14 days and significant cost. The UAE's Habshan-Fujairah pipeline has a nominal capacity of 3.5 million barrels per day. Both absorbed volume at levels that exceeded pre-crisis utilization assumptions, because the economic pressure to move cargo was high enough to fund operational workarounds that weren't worth doing before.
Insurance markets restructured rather than retreating. War-risk insurance premiums hit approximately 40 times pre-crisis levels in September. Conventional logic said commercial shipping would exit the corridor at that price. Instead, new underwriters entered, risk-sharing structures were created, and state-backed coverage programs emerged in several countries. The market adapted rather than collapsed.
China's SPR management suppressed apparent demand for months. China cut visible commercial imports by approximately 32% while drawing down Strategic Petroleum Reserve stocks, effectively hiding true industrial demand from global markets and delaying visible shortage signals that would have triggered a more aggressive response earlier. The SPR functioned as a demand-management tool, not a passive reserve.
The cumulative effect was a supply chain that held longer and absorbed more disruption than the model predicted. This is genuinely good news. It tells us that supply chain systems have more embedded resilience than static models capture, and that actors under pressure will find innovative solutions that weren't obvious before the pressure existed.
“The supply chain didn't break because the actors in it kept finding new levers. The question at Day 240 is whether those levers are running out.”
The shadow fleet is operating near capacity. Cape routing adds cost that eventually prices some cargoes out of the market entirely. The UAE pipeline is at or near its design limit. China's SPR drawdown cannot continue indefinitely without compromising strategic reserve purposes. The resilience mechanisms that absorbed the first eight months of this crisis were largely one-time structural adaptations. Whether there are comparable second-round adaptations available is the open question.
The conflict was more sophisticated than we modeled. The other side kept innovating too.
The supply-side resilience story has a mirror image. The model also underestimated the strategic sophistication of the actors driving the disruption.
A standard military disruption model treats conflict as a source of noise: random events that reduce flow below capacity by some percentage. What actually happened was more purposeful than that.
The October attack pattern was not random. In September, Gulf oil flows (excluding Iran) recovered to more than 81% of pre-war levels on the best days. Middle East crude exports exceeded pre-war levels on 14 days in September (Kpler). Markets began pricing in normalization. Polymarket odds for normal traffic by year-end moved upward.
Then, in the week of September 28, ten tankers were struck. Fifteen more were struck during the week of October 6–14, followed by eleven more in just four days. Flows crashed from 20.8 million barrels per day on October 8 to 2.9 million barrels per day on October 11, an 86% drop in 72 hours.
The targeting was calibrated to the recovery. The actors on the conflict side were watching the same flow data everyone else was watching, and they intervened at precisely the moment when markets were beginning to normalize.
The prohibited zone declaration followed the same logic. On September 6, Iran's Security Council head declared a prohibited zone around the strait. That declaration came as alternative routing and shadow fleet operations were demonstrating that commercial flow could be maintained at partial levels. The declaration was a second-order response to the supply-side resilience – an escalation designed to offset adaptation.
The result is a system in which supply-side actors innovate to restore flow, conflict-side actors innovate to disrupt it, and the equilibrium keeps resetting at a level of sustained disruption rather than trending toward resolution.
“Both sides kept finding new levers. The crisis is not winding down, it is evolving.”
This is what complex adaptive systems actually look like.
The model's structural assumption that actors respond to disruption rather than reshape it is the standard assumption in supply chain risk modeling. It is also the assumption that fails most dramatically in prolonged, high-stakes disruptions.
A complex adaptive system is one where every actor's response updates the environment that other actors are responding to. The supply chain's shadow fleet expansion changed the flow data the conflict side was targeting. The conflict side's October attacks changed the insurance market's risk calculus. The insurance market's restructuring changed what cargoes could move. Every adaptation triggered a counter-adaptation.
Philip Tetlock's work on expert forecasting describes this as the difference between systems that are complicated and systems that are complex. Complicated systems have many parts, but those parts behave predictably. Complex systems have actors who learn, adapt, and strategically respond to what they observe. Predicting complicated systems is hard but possible. Predicting complex systems requires a different framework entirely, one that models the adaptation process, not just the initial shock.
Goldman Sachs has described the current state as “de-Straitization,” a structural adaptation where 70% of normal flow functions as the new baseline. That view captures the supply-side resilience story. What it underweights is the conflict side's demonstrated willingness to prevent that baseline from stabilizing. The October data suggests we are not yet at a new equilibrium. We are in a dynamic contest between actors innovating on resilience and actors innovating on disruption.
That contest is not something any static model can resolve. But talking about it clearly is the first step toward building planning frameworks that account for it.
The report card at Day 240.
How the original predictions have held up, including the two structural misses the model didn't anticipate.
The report card at Day 240 (accompanying figure).
How the original predictions have held up, including the two structural misses the model didn't anticipate.
What supply chain leaders should be asking right now.
Day 240. Brent crude at $114.64. War-risk insurance at approximately 32 times pre-crisis levels. Crisis pressure index at 88. This is extreme. The October attacks have pushed flows back toward crisis lows after a September that briefly looked like the beginning of normalization.
The supply-side resilience that absorbed the first eight months was real and impressive. The shadow fleet, alternative routing, restructured insurance markets, and Chinese SPR management all exceeded what a pre-crisis model would have projected. The actors in the supply chain system found more levers than we gave them credit for.
But there are real limits to how far that innovation can go. The one-time structural adaptations are largely in place. The incremental gains from here are smaller and more expensive. And the conflict-side actors have demonstrated they are watching for normalization signals and will respond to them.
The strategic question for your organization is not “when does this end?” It is: what does your supply chain look like if the dynamic contest between supply-side resilience and conflict-side escalation continues for another six months? Another year? What is your plan if the levers your supply partners have been pulling start running out?
Stop planning for a reopening date. Start mapping your exposure to the second stage of this crisis: the stage where the one-time adaptations are exhausted and the underlying disruption is still in place.
The model wasn't wrong about the physical cascade. It was wrong about the nature of the system it was modeling. Eight months of data make that correction possible. The correction that matters now is building planning frameworks that treat supply chain disruption not as a shock to absorb, but as a dynamic contest to monitor.
Both sides kept innovating. That's the lesson. The question is who runs out of ideas first.
About the author.
Chris Gaffney is Managing Director, Georgia Tech Supply Chain and Logistics Institute (SCL) and Edenfield Executive-in-Residence within the H. Milton Stewart School of Industrial and Systems Engineering.
The Hormuz simulation described in this piece was developed by the SCL research team in early 2026. Data sources: IEA, EIA, Kpler, Vortexa, DTN, World Bank, IMF PortWatch, and open-source shipping intelligence. Questions and feedback: jgaffney6@gatech.edu.